This stock had a story before you.
A quote chart can begin years before you were involved. That history matters to the market, but it is not yet your investment experience.
You entered here.
Your personal story begins at the exact point where your first purchase intersects the market price. Earlier history becomes context; your transactions become the frame.
Same stock. Different question.
Market asks what the stock did over the selected interval. You asks how your own investment has performed since your money entered. The answers can point in opposite directions.
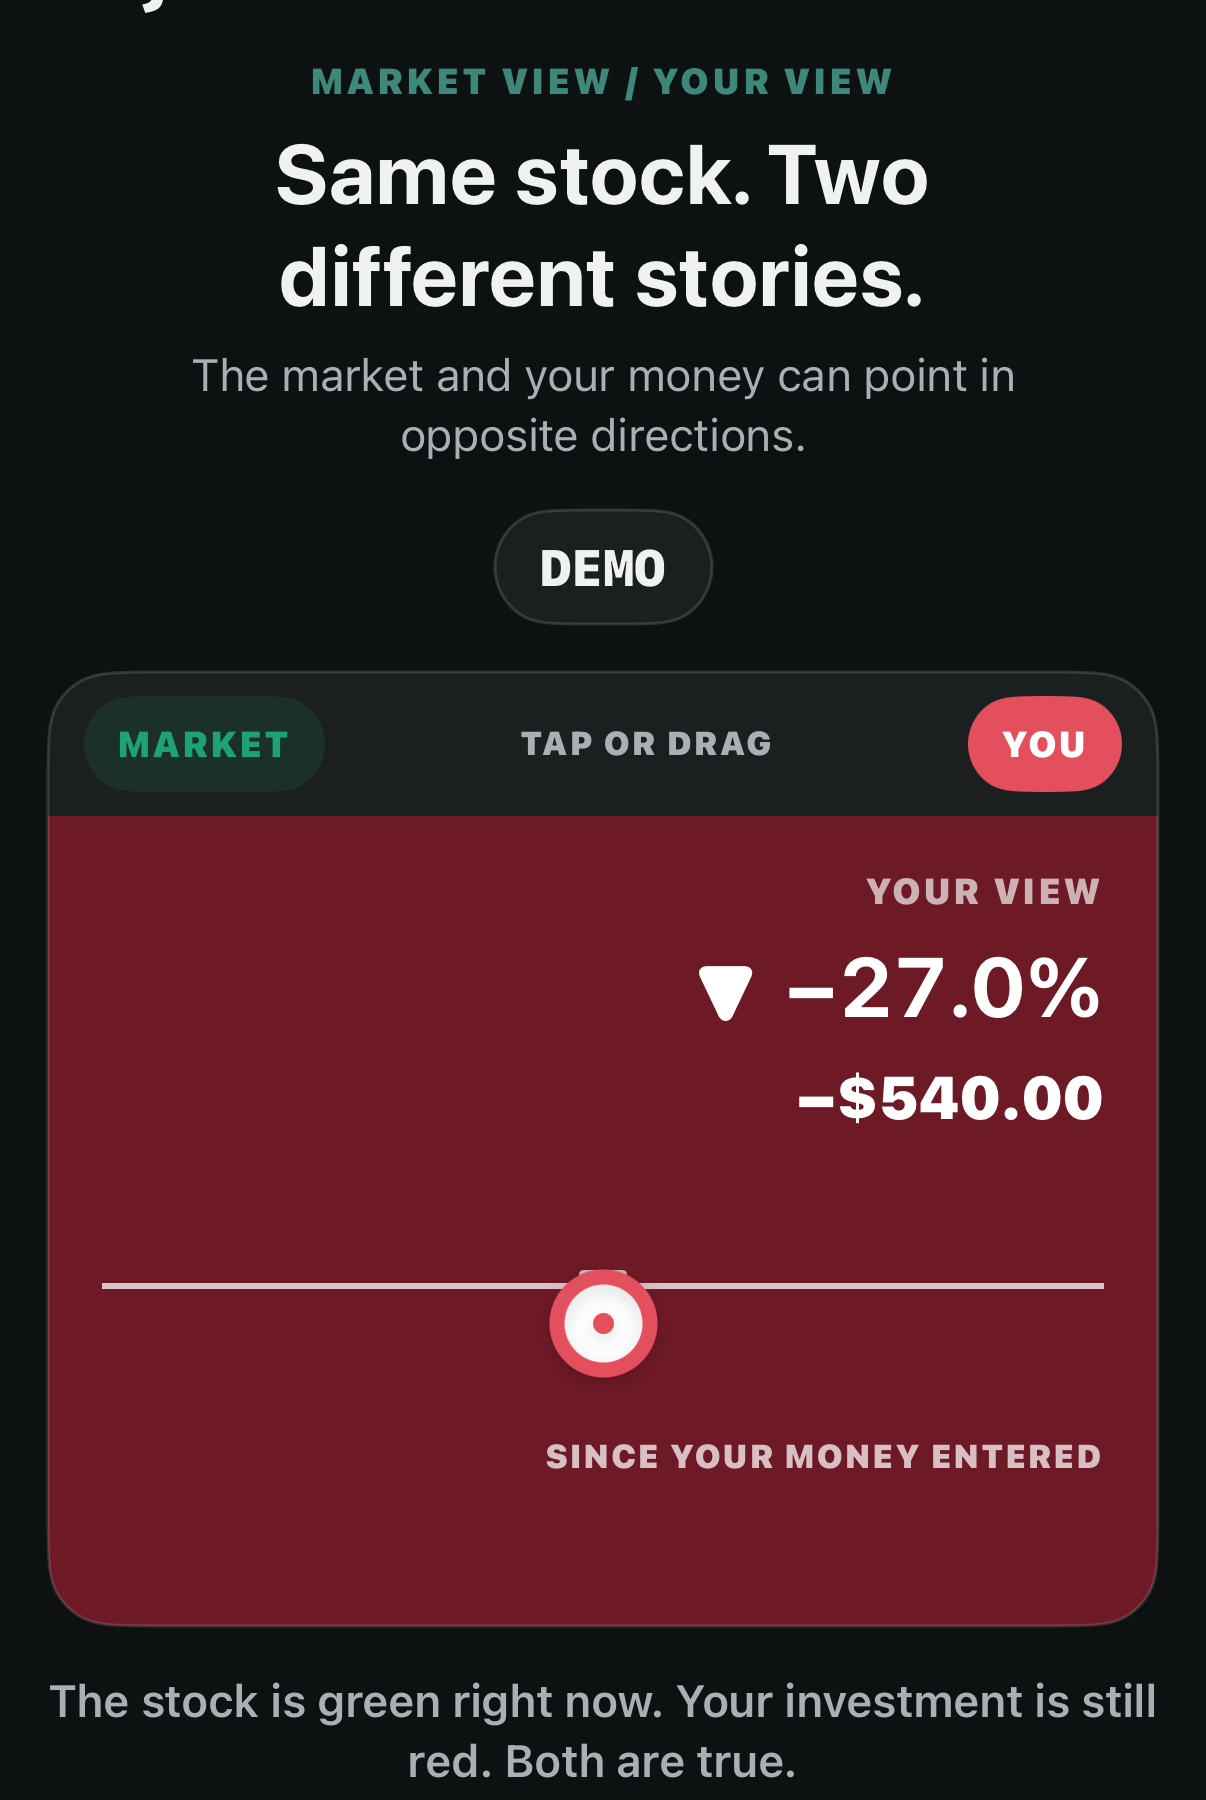
Same fictional stock
Market +28%. You −27%.
Green and red are not verdicts on the stock. They describe the result of the question currently on screen. The fictional DEMO security makes the contrast clear without assigning invented performance to a real company.
Visible Market and You controls invite a tap, while the chart also responds to dragging. Accessibility never depends on dragging alone.
MY MONEY becomes the center.
The personal view uses a centered zero based on net capital deployed. Ahead is above. Behind is below. The vertical range remembers the best and worst personal outcomes while you owned the investment, and the ring marks where the position is now.
Personal view anatomy
- AHEAD
Your investment’s current personal result is positive.
- MY MONEY
The centered reference for the net capital you put in.
- BEHIND
Your investment’s current personal result is negative.
- PERSONAL RANGE
Your best and worst outcomes during the time you owned it.
Buy more: the market did not change. Your position did.
A new purchase changes your shares and your net capital. It does not rewrite the market price. This is why transaction history belongs in the picture.
RIVR · unchanged in this example
10 shares · $1,000 invested
The market is still $80. Buy More changes only your position.
Your entire portfolio works this way.
Each investment gets a narrow vertical lane. Every lane shares the centered MY MONEY baseline, so winners, break-even positions, and losses can be compared without hiding their individual range.
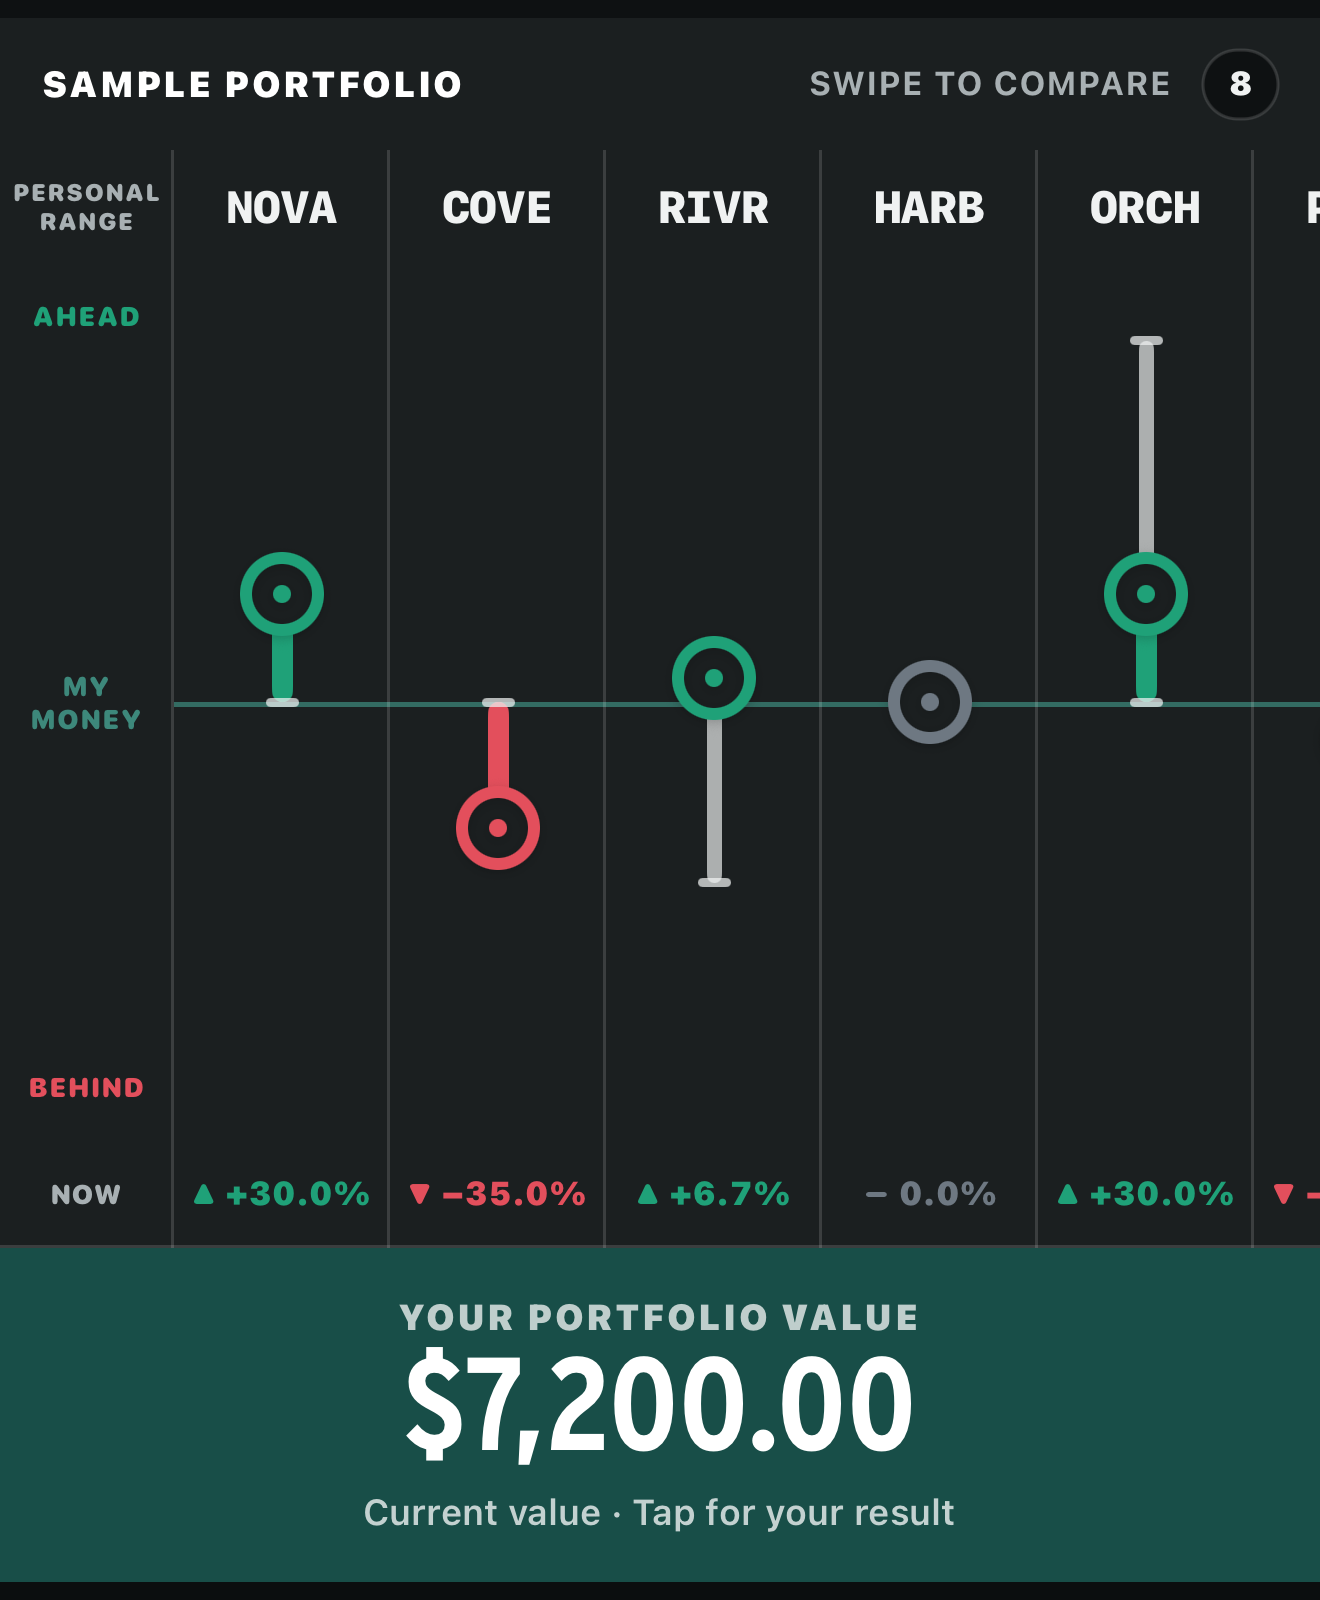
Portfolio
Value first. Result when you ask.
The primary total is Your Portfolio Value. Tap it in the app to see Your Portfolio Result. The sample deliberately includes meaningful winners, modest winners, break-even, modest losses, and a substantial loser.
Even the ticker is yours.
A conventional ticker reports today’s market move. doji’s ticker reports your actual dollar and percentage return for each investment. Expanded layouts use Manny’s outlined direction triangles; compact layouts use small solid triangles.
How the personal result is calculated
The Journey view keeps the full economic relationship visible. Journey value is the market value of shares still held, plus cumulative sale proceeds and cash dividends, minus separate cash outflows such as fees. Net capital deployed is the cash contributed to purchases, including purchase fees, adjusted by explicit external-capital events.
The Position view focuses on what remains open now: current shares, current market value, and the portion of unrecovered capital associated with the open position. Realized cash stays in Journey, so a partial or full sale does not erase your history.
What transactions do
- Buy: adds shares and investor capital; a purchase fee increases that capital.
- Sell: removes shares and adds net proceeds to cash returned; a sale fee reduces those proceeds.
- Cash dividend: adds cash returned without changing shares.
- Reinvested dividend: adds shares as internal compounding without pretending new external cash was contributed.
- Split: changes share count and per-share price consistently, but creates no value by itself.
Important distinctions
Personal performance in doji is not tax basis, time-weighted return, money-weighted return, annualized return, or investment advice. These measures answer different questions. Missing transaction prices are not silently invented, and incomplete historical ranges are labeled. Use brokerage and tax records for authoritative reporting.